Monday, 29 October 2012

HEXAWARE TECHNOLOGIES

From the above chart of hexaware we can see that after falling from 140 levels to 110 levels and i feel at CMP it is worth buying.Signs of bullish reversal can be clearly seen on the charts,ParabolicSAR,candlesticks and MACD are giving a buy side.So one can BUY HEXAWARE NOVEMBER FUTURES@ 110.110.3 with a target of 115.

Thursday, 25 October 2012

KARNATAKA BANK
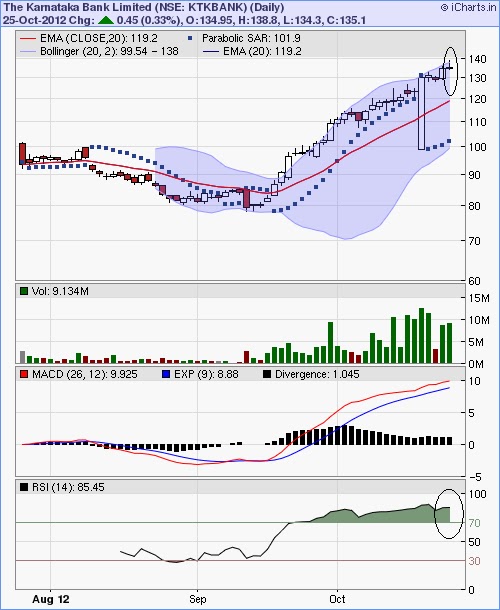

 
 From the above chart of KARNATAKA BANK we can se that it has moved from 80 level to 138-140 levels in a matter of one month that too without any significant correction.Yesterday was the first bearish sign which i felt in this stock, a GRAVESTONE DOJI was formed.Daily RSI of KARNATAKA BANK IS 85.45 whereas Weekly RSI is 76, i am expecting this rally to pause and correct a bit from these levels. So in that case one can short KARNATAKA BANK NOVEMBER FUTURES @136-139 with a target of 130-125.

Tuesday, 16 October 2012

HERO MOTOCORP

We can clearly see Morning Star candlestick pattern on the daily charts of Hero MotoCorp.We can also see that previously HEROMOTOCORP took support @ 1750 levels..so in that case one can sell 1750 OCTOBER STRIKE PUT @ 18 and simultaneously buying HEROMOTOCORP OCTOBER FUTURES @ 1785-1790. BUY BACK HEROMOTOCORP OCTOBER 1750 STRIKE PUT @ 5. HEROMOTOCORP OCTOBER FUTURES has a target of 1820.

Wednesday, 10 October 2012

RELIANCE CAPITAL

From the above chart of RELIANCE CAPITAL we can clearly see that ParabolicSAR, RSI have shown SELL signs and MACD line is very close to the SIGNAL line that means MACD is also about to give a sell sign on RELIANCE CAPITAL.Weekly RSI is also in the overbought zone(67),so it is a very good SELL at this point of time. Institutional investors still haven't booked their profits in this script, when they start booking profits this script will crash like anything.
So trade that can be formed in this script is: SHORT SELL RELCAPITAL OCTOBER FUTURES@ 446 and BUY @ 430.

Monday, 8 October 2012

RELIANCE INDUSTRIES

From the above chart of RELIANCE INDUSTRIES we can see evening star candlestick formation on reliance with increase in volumes. We can also see that it has closed below its 20 day exponentional moving average(829.2) so we can expect RELIANCE to test its 50 day exponential moving average(802).
So one can SHORT SELL RELIANCE INDUSTRIES OCTOBER FUTURES @ 826 and BUY @ 815. 

INDUSIND BANK

We can clearly see from IndusInd Bank daily chart that a tri-star doji pattern is formed with a RSI of 78. My view on Nifty is slightly bearish(can correct upto 5600 levels)so i fell IndusInd Bank too can correct from these levels.                           
So in that case one can SHORT SELL INDUSINDBANK OCTOBER FUTURE @ 370 and BUY @ 362-360.

HDIL


From the above graph of HDIL we can clearly see evening star candlestick pattern and bearish engulfing pattern are formed with a RSI of 74.So in that case one can short HDIL OCTOBER FUTURES @ 105.5 and buy back @ 100.