
Wednesday, 28 January 2015
NIFTY VIEW
VIEW ON CRUDE OIL

From the above chart of of crude oil we are clearly able to see crude oil was moving in triangular pattern with the high 115$ and low of 65$. 115$-65$=50. The Break down of the Triangle pattern happened @ 95$ . The target of this was near 95-50=45$. The CMP is around 44.5$, it looks a lucrative bullish bet. RSI confirmed the triangle pattern and now crude oil is deeply oversold. Targets are 77$(38.2% retracement),91$(50% retracement),105$(61.8% retracement).
View on USD INR

From the above chart of USDINR we are able to see prices took resistance @ 50% retracement of the move from 68 odd levels to 58. I would advise to go long in USD INR with targets of 62.30, 63.5, 64.75. If by any chance if the prices close above 64.75, 68 would be a probable target. My ultimate target for USD-INR is 72. RSI confirms the USDINR contract was oversold so longs in it are justified.
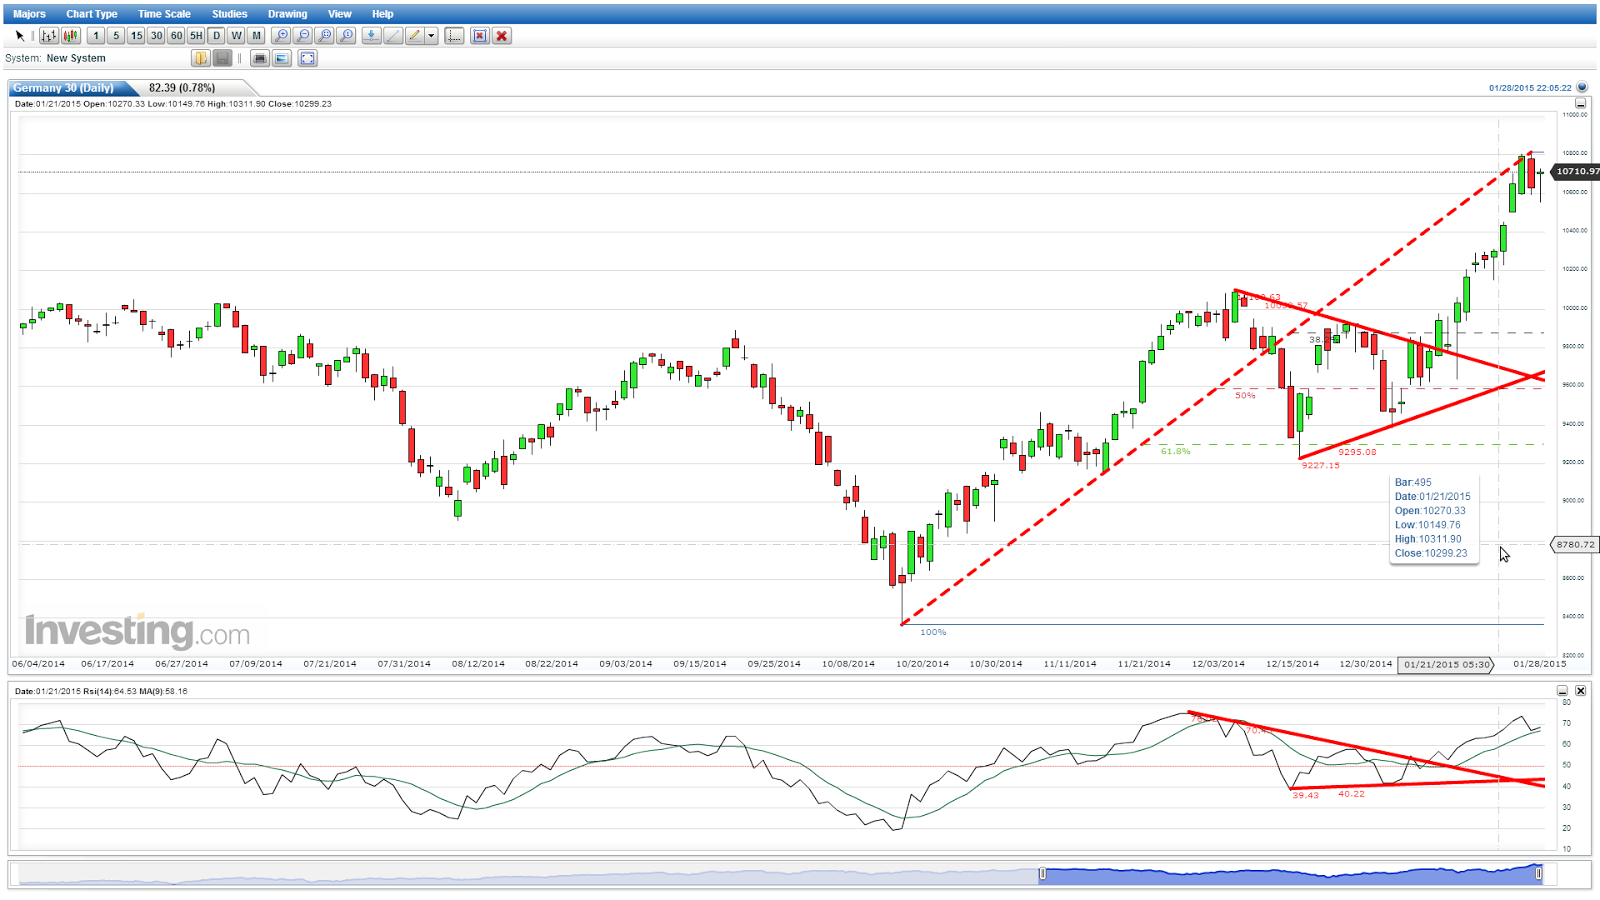
VIEW ON DAX
VIEW ON DOW JONES INDUSTRIAL AVERAGE

From the above chart of Dow Jones, we are clearly able to see the prices were moving in a triangular pattern on 28 January prices have broken down from the triangular pattern, which is a very dangerous sign. Earlier the prices took support @ 38.2 retracement from the lows of 15855 to the highs of 18103. Target pattern of this comes out @ High of the Triangle pattern- Low of the Triangle pattern, 18103-17067=1036. 16200 is a possible target on Dow Jones in a couple of days. RSI confirms the breakdown of the price as it was also moving in tandem with the price, making a triangle pattern. Shorts should be accumulated for targets of 16200-16300.
Subscribe to:
Posts (Atom)