
Tuesday, 16 June 2015

Monday, 15 June 2015


Sunday, 14 June 2015

Saturday, 16 May 2015

Tuesday, 12 May 2015


Saturday, 18 April 2015

Friday, 17 April 2015

Thursday, 16 April 2015


Wednesday, 15 April 2015

Tuesday, 14 April 2015

Sunday, 5 April 2015

Friday, 3 April 2015

Thursday, 2 April 2015

Tuesday, 31 March 2015


Monday, 30 March 2015

Sunday, 29 March 2015

Thursday, 12 March 2015

Wednesday, 11 March 2015

Sunday, 8 March 2015


Wednesday, 4 March 2015


Monday, 2 March 2015


EUR/USD VIEW

The euro is not out of the woods by a long shot yet, but this morning’s data suggests that EUR/USD could continue to hold above its 12-year low at 1.1100 in the near term. The chart broadly supports this view: though it’s too soon to call today’s trough a higher low, the current bullish divergence with the RSI indicators suggests that selling pressure is receding. Meanwhile, rates could be forming a bullish Piercing Candle*, which if confirmed, would indicate an intraday shift from selling to buying pressure and raise the probability of a rally from here.
In the immediate term, the February lows near 1.1280 could now provide resistance on any rallies, and if that barrier is eroded, a move back up to the 23.6% Fibonacci retracement at 1.1440 could be seen next. Of course, a run of strong US data or a renewed downturn in Europe could always change this cautiously-optimistic view of the pair, so if we see a break to new lows under 1.1100, bulls may abandon their positions as sellers press for the 1.10 level.
**A Piercing Candle is formed when a candle trades below the previous candle's low, but buyers step in and push rates up to close in the upper half of the previous candle's range. It suggests a potential bullish trend reversal.
Sunday, 1 March 2015


Friday, 27 February 2015


Tuesday, 24 February 2015

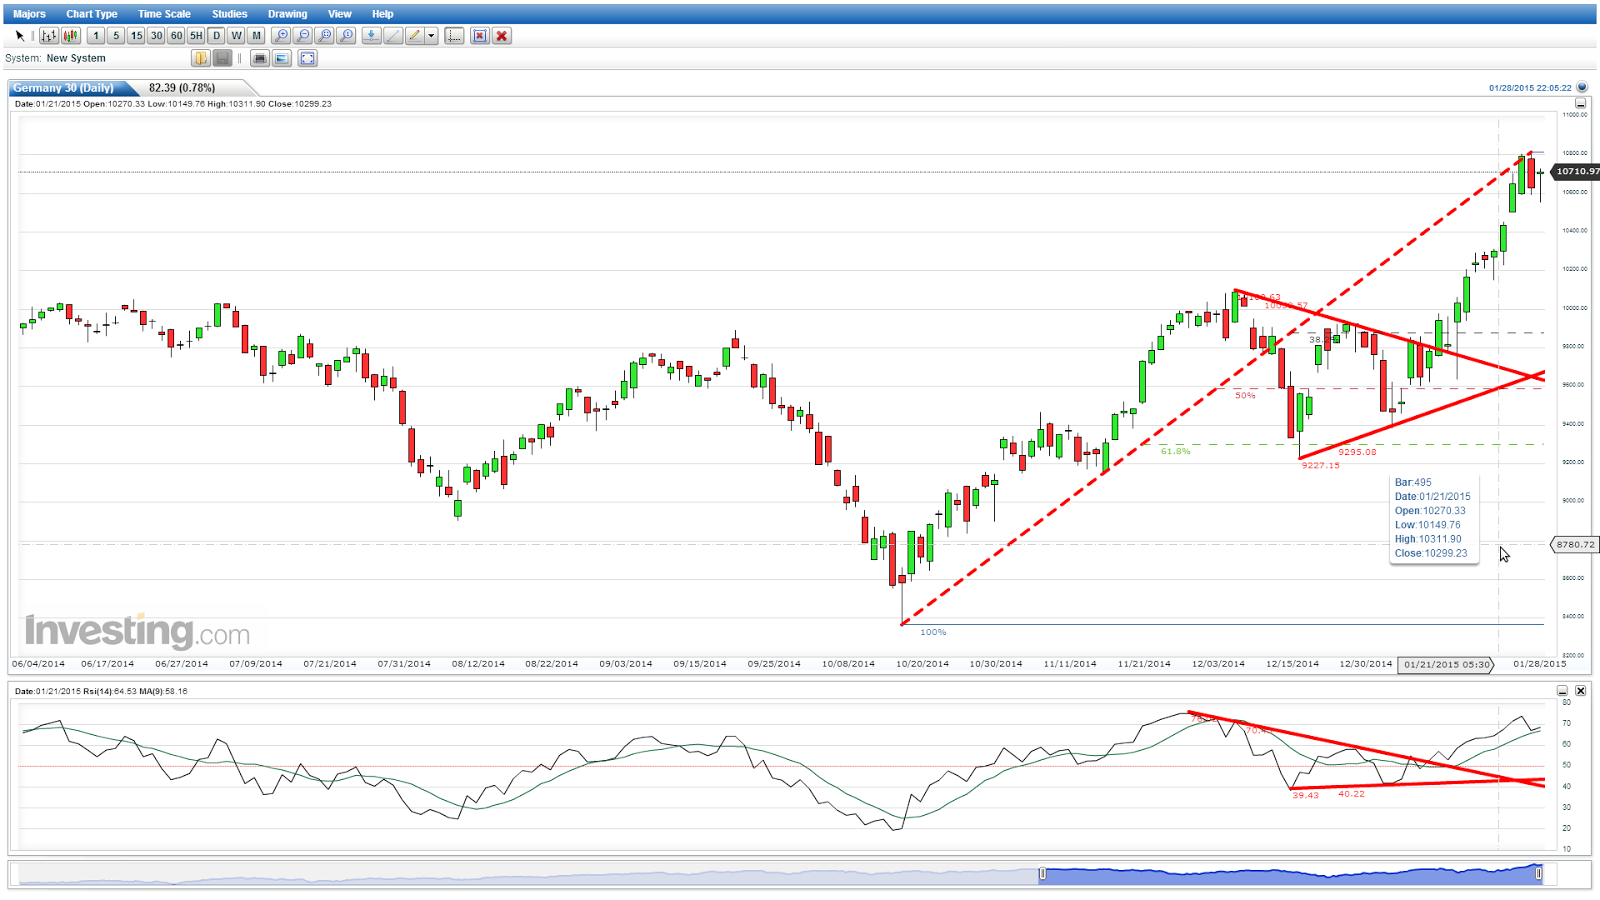
VIEW ON DAX

VIEW ON GOLD

From the above chart(daily) of gold we are able to see Gold is coming into oversold zone (34.5) on RSI and is at an important Fibonacci support of 61.8% which is at 1198. Today's low(24/02/2015) is 1194 and CMP of 1198. I think price of the yellow metal will appreciate from here on. Target 1: 1218, Target 2: 1240.
Wednesday, 28 January 2015
NIFTY VIEW

VIEW ON CRUDE OIL

From the above chart of of crude oil we are clearly able to see crude oil was moving in triangular pattern with the high 115$ and low of 65$. 115$-65$=50. The Break down of the Triangle pattern happened @ 95$ . The target of this was near 95-50=45$. The CMP is around 44.5$, it looks a lucrative bullish bet. RSI confirmed the triangle pattern and now crude oil is deeply oversold. Targets are 77$(38.2% retracement),91$(50% retracement),105$(61.8% retracement).
View on USD INR

From the above chart of USDINR we are able to see prices took resistance @ 50% retracement of the move from 68 odd levels to 58. I would advise to go long in USD INR with targets of 62.30, 63.5, 64.75. If by any chance if the prices close above 64.75, 68 would be a probable target. My ultimate target for USD-INR is 72. RSI confirms the USDINR contract was oversold so longs in it are justified.
VIEW ON DAX
VIEW ON DOW JONES INDUSTRIAL AVERAGE

From the above chart of Dow Jones, we are clearly able to see the prices were moving in a triangular pattern on 28 January prices have broken down from the triangular pattern, which is a very dangerous sign. Earlier the prices took support @ 38.2 retracement from the lows of 15855 to the highs of 18103. Target pattern of this comes out @ High of the Triangle pattern- Low of the Triangle pattern, 18103-17067=1036. 16200 is a possible target on Dow Jones in a couple of days. RSI confirms the breakdown of the price as it was also moving in tandem with the price, making a triangle pattern. Shorts should be accumulated for targets of 16200-16300.
Subscribe to:
Comments (Atom)