Tuesday 4 December 2012

MOODY'S VIEW ON INDIAN BANKING SYSTEM.


Moody's maintains negative outlook on Indian banking system.

Moody’s Investors Service on Tuesday said its outlook on the Indian banking system for the next 12-18 months remains negative, reflecting the continued challenging nature of its domestic operating environment.

The global credit rating agency has had a negative outlook on the Indian banking system since November 2011.
...

“This environment is characterised by slow economic growth, high inflation, high interest rates, and a weak local currency, and we expect these factors to lead to a further deterioration in asset quality, an increase in provisioning costs, and a fall in profitability,’’ said Vineet Gupta, Moody’s Vice-President and Senior Analyst.

Further, considering the high level of loan growth which, at about 15 per cent annually, is expected to continue outstripping internal capital generation, then most of the Moody’s-rated Indian banks will be challenged to maintain capitalisation levels at current levels, and some will even need to raise new capital externally, Gupta added.

Furthermore, Moody's views the loan classification — more particularly with regards to restructured loans — and provisioning practices in India as weak.

“Loan classification and provisioning requirements mask the extent of the banks’ asset quality and capital challenges,’’ said Gupta.

On the positive side, Moody’s, in a statement said one anchor of stability for Indian banks is their strong business franchises, which support their low-cost funding profiles, helping them maintain sizeable lending margins to sustain pre-provision earnings.

Moody’s is continuing to assume a relatively high probability of systemic support, observing that the Indian Government already provides strong ongoing support in the form of annual equity infusions for the public sector banks, and all banks are mandated to meet loan quotas for certain sectors of the economy.

This implies a high degree of involvement by the Government in the banking sector and related public accountability.

BANK NIFTY VIEW

From the above chart of BANKNIFTY we can clearly see that BANKNIFTY is in an overbought position, RSI Williams's %R Bollinger Bands and StochRSI showing the same, so i don't think it has the potential to go further up without a small correction.I would advise to SELL BANKNIFTY 27 DECEMBER 12500 CALL@ 140-145 with a target of 100.

Thursday 22 November 2012

RELIANCE INDUSTRIES

From the above chart of Reliance Industries we ca clearly see that the stock is oversold and it is in the range from which it has bounced previously also.So i would advise to buy Reliance Industries November Futures @ 761-763 with a target of 775-780.

Sunday 18 November 2012

Dow Jones Industrial Average

From Dow Jones daily chart we can see Bullish engulfing cum hammer like situation with increase in volumes and RSI of 28.39 and range (12500-12600) from which Dow jones index has bounced 3 times previously.Now is the time for short sellers to book their profits as now i see the markets in the hands of the bulls.My target for Dow Jones would be 12900-13100-13300.

Monday 29 October 2012

HEXAWARE TECHNOLOGIES

From the above chart of hexaware we can see that after falling from 140 levels to 110 levels and i feel at CMP it is worth buying.Signs of bullish reversal can be clearly seen on the charts,ParabolicSAR,candlesticks and MACD are giving a buy side.So one can BUY HEXAWARE NOVEMBER FUTURES@ 110.110.3 with a target of 115.

Thursday 25 October 2012

KARNATAKA BANK


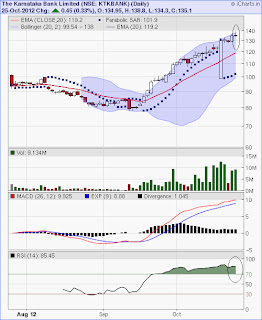
 From the above chart of KARNATAKA BANK we can se that it has moved from 80 level to 138-140 levels in a matter of one month that too without any significant correction.Yesterday was the first bearish sign which i felt in this stock, a GRAVESTONE DOJI was formed.Daily RSI of KARNATAKA BANK IS 85.45 whereas Weekly RSI is 76, i am expecting this rally to pause and correct a bit from these levels. So in that case one can short KARNATAKA BANK NOVEMBER FUTURES @136-139 with a target of 130-125.

Tuesday 16 October 2012

HERO MOTOCORP

We can clearly see Morning Star candlestick pattern on the daily charts of Hero MotoCorp.We can also see that previously HEROMOTOCORP took support @ 1750 levels..so in that case one can sell 1750 OCTOBER STRIKE PUT @ 18 and simultaneously buying HEROMOTOCORP OCTOBER FUTURES @ 1785-1790. BUY BACK HEROMOTOCORP OCTOBER 1750 STRIKE PUT @ 5. HEROMOTOCORP OCTOBER FUTURES has a target of 1820.

Wednesday 10 October 2012

RELIANCE CAPITAL

From the above chart of RELIANCE CAPITAL we can clearly see that ParabolicSAR, RSI have shown SELL signs and MACD line is very close to the SIGNAL line that means MACD is also about to give a sell sign on RELIANCE CAPITAL.Weekly RSI is also in the overbought zone(67),so it is a very good SELL at this point of time. Institutional investors still haven't booked their profits in this script, when they start booking profits this script will crash like anything.
So trade that can be formed in this script is: SHORT SELL RELCAPITAL OCTOBER FUTURES@ 446 and BUY @ 430.

Monday 8 October 2012

RELIANCE INDUSTRIES

From the above chart of RELIANCE INDUSTRIES we can see evening star candlestick formation on reliance with increase in volumes. We can also see that it has closed below its 20 day exponentional moving average(829.2) so we can expect RELIANCE to test its 50 day exponential moving average(802).
So one can SHORT SELL RELIANCE INDUSTRIES OCTOBER FUTURES @ 826 and BUY @ 815. 

INDUSIND BANK

We can clearly see from IndusInd Bank daily chart that a tri-star doji pattern is formed with a RSI of 78. My view on Nifty is slightly bearish(can correct upto 5600 levels)so i fell IndusInd Bank too can correct from these levels.                           
So in that case one can SHORT SELL INDUSINDBANK OCTOBER FUTURE @ 370 and BUY @ 362-360.

HDIL


From the above graph of HDIL we can clearly see evening star candlestick pattern and bearish engulfing pattern are formed with a RSI of 74.So in that case one can short HDIL OCTOBER FUTURES @ 105.5 and buy back @ 100.

Sunday 7 October 2012

WALL STREET VIEWS

Source:Reuters

Wall Street may be bracing for a pullback as US earnings season begins next week - if the clouds of profit warnings from bellwethers ranging from FedEx to Hewlett-Packard lead to a downpour of lower profits - or even losses.


Thanks to aggressive stimulus plans from central banks around the world, the Standard & Poor's 500 index gained 5.8 percent over the third quarter. That sharp rally occurred even as companies were struggling. Earnings for that period are forecast to fall 2.4 percent from the year-ago quarter. If that happens, this would be the first earnings decline in three years, according to Thomson Reuters data.

Market strategists and investors say US stock valuations are broadly out of sync with earnings estimates. They forecast a pullback in stocks in the coming weeks as more companies report results and reduce expectations for the fourth quarter and beyond.

Fourth-quarter estimates for S&P 500 companies show a 9.5 percent gain in profit from a year ago, according to Thomson Reuters data. Analysts say that outlook is too high, given what investors are already hearing from the corporate world.

"It's a divergence right now where the valuations as far as equity prices (are concerned) have soared, and are really putting in place a stronger economy and stronger fundamentals," said Alan Lancz, president of Alan B. Lancz & Associates Inc., an investment advisory firm in Toledo, Ohio.

"But earnings will be the telltale sign," Lancz added. "And if the guidance isn't particularly strong, the market might be setting itself up for a little disappointment. I don't see a major correction, but I do see a pullback."

The earnings season will kick off on Tuesday with results from Dow component Alcoa


TECH FEELS CHILL FROM CHINA


While estimates have come down sharply in all 10 S&P 500 sectors since the start of the year, technology is one area where the lower expectations are most notable. Slower growth in China is a big factor in that trend.


Earnings growth in the tech sector is expected to be just 2.3 percent for the quarter, compared with a July 1 forecast of 13.1 percent.


SBI


One can see from the above chart that State Bank of India is in an overbought zone with RSI of 79.ParabolicSAR is also giving a sell sign on SBI.On the last trading day we were able to see an increase in volume too.
In that case one can SHORT SELL SBI OCTOBER 2400 CALL @ Rs41 AND BUY BACK @Rs 30.

NIFTY VIEW


As per Nifty weekly and daily charts we can clearly see nifty is in an overbought zone.Closely looking at daily chart we can see technical indicators like RSI, Parabolic SAR and Candlesticks(Bearish Engulfing with increase in volumes) giving a sell sign and while looking at the weekly chart Bollinger Bands(very close to the upper tip of the Bollinger Band),ParabolicSAR,RSI are giving sell signs.
So i expect Nifty to correct a bit,in that case one can SHORT SELL NIFTY OCTOBER 5700 STRIKE CALL @ Rs120 AND BUY BACK @Rs100.One can also SHORT SELL NIFTY NOVEMBER 5800 STRIKE CALL @ Rs 140 AND BUY BACK @ Rs.120.

Friday 5 October 2012

ICICI BANK


One can clearly see a dark cloud cover cum hanging man candle formed on icici bank daily chart which indicates bearishness in the stock, MACD is also about to give a sell sign, RSI is also showing that it is overbought so i expect it to fall a bit.                           
So in that case one can Short Sell ICICIBANK OCTOBER 1100 STRIKE CALL @ 23-24 and Buy around 15.

GOLD


One is clearly able to see on the weekly charts that the gold is facing a resistance at $1790 as it has retraced from those levels two times before also and on the daily chart one is able to see a formation of dark cloud cover with weekly RSI of 68 and daily RSI of 70 so i would go with the trade that one can short gold @ 1790 levels and buy back around 1770.

LARSEN & TOUBRO

There is a hanging man candle formed on larsen and tourbo weekly chart(although it was due to flash crash that happened in nifty today),the weekly RSI(69) and daily RSI(76) are suggesting it is highly overbought so we can expect some correction, trade that one can form is by short selling october 1700 strike call @ 27 and buy back around 16.

ADANI POWER

Formation of dark cloud cover pattern on adani power daily chart with RSI also showing overbought signs ,there is decent amount of volume supporting the fact that bears are now active in it, so one can trade on adani power by selling its october futures@ 54 and simultaneously buying 55 october strike call @ 2-2.5 for protection.